Stock market froth
A weekly read on how bubbly the market is.
I had cash sitting idle and no honest way to decide when to put it to work. Every headline argued both sides, and “wait for the crash” isn’t a plan. So I built a gauge.
What I wanted from it
Three rules. It had to be probabilistic: “X% odds of a downturn within N months,” not “the market is overvalued.” It could be wrong on magnitude but not on direction. And it had to be backtestable, so I’d know whether it’s a model or a mood.
How it works
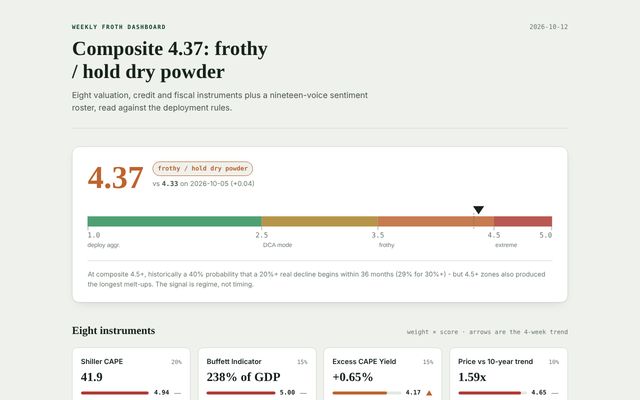
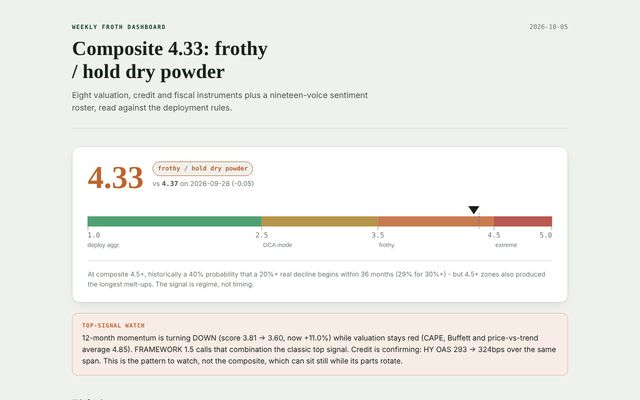
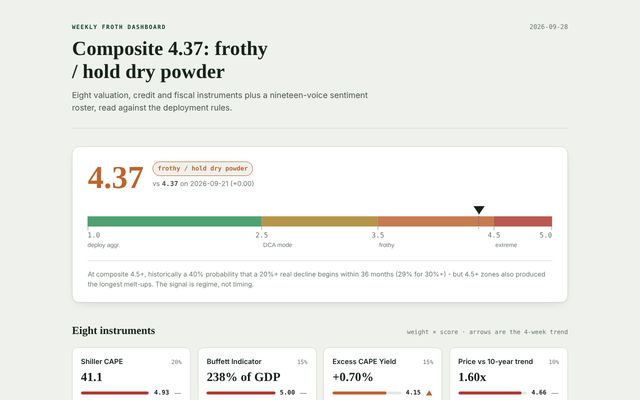
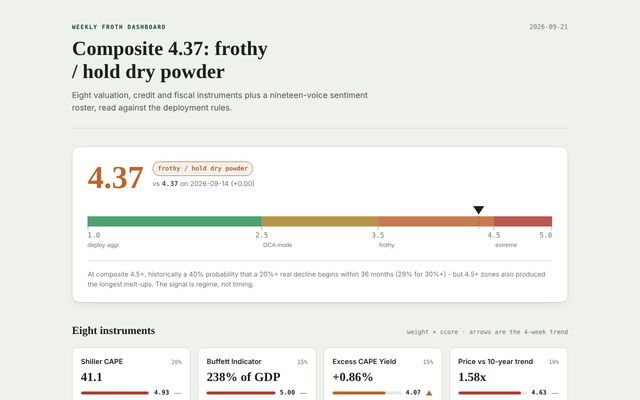
Eight instruments, each scored from 1 to 5 and weighted into a single composite:
- Shiller CAPE
- the Buffett Indicator (market cap to GDP)
- excess CAPE yield
- price against its ten-year trend
- twelve-month momentum
- high-yield credit spreads
- the 10-year minus 2-year yield curve
- the federal fiscal trajectory
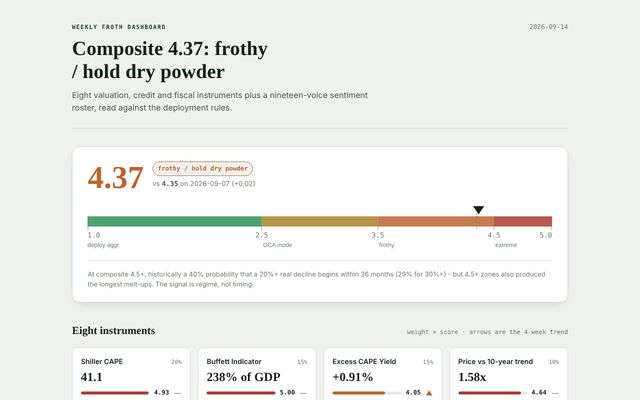
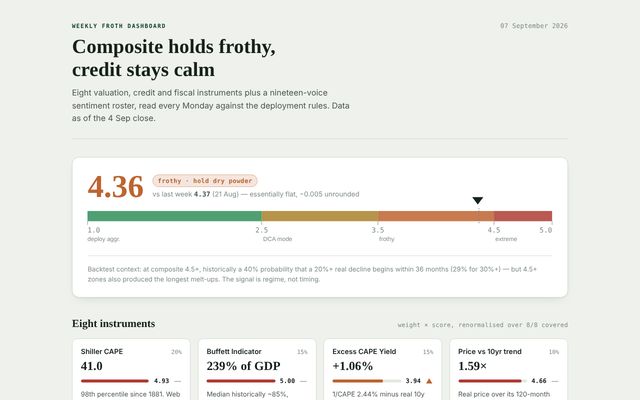
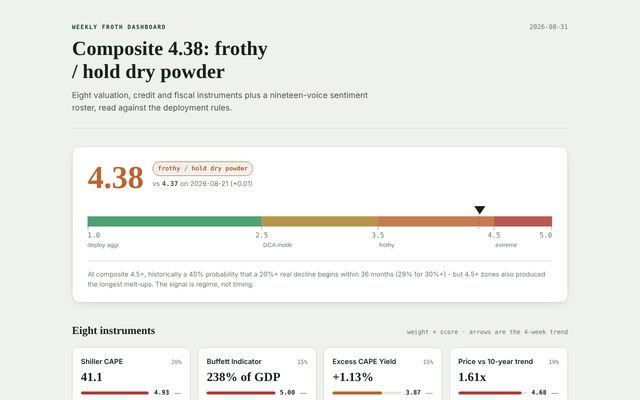
The composite is backtested on Shiller’s data back to 1881. The headline finding keeps me humble: at 4.5 and above, there’s historically about a 40% chance a 20%+ real decline begins within three years, but those same zones produced the longest melt-ups. The signal is the regime, not the timing.
Credit spreads matter more than their weight suggests. They tend to move first, so they’re the tripwire I watch between runs.
Whose opinions count
Numbers miss what serious people are actually saying, so every run also places nineteen investors and economists by where they think the market goes over 12, 24 and 36 months, and how strongly they hold it. The roster leans toward the people I trust, starting with the Buffett, Munger and Graham school, and deliberately leaves out activist investors. Anything a voice said more than six months ago drops off.
Here’s where all nineteen sit, run by run. Press play, or drag the slider, and watch them migrate: right is more bullish on the next year, up is more bullish on the next three, and bigger dots hold their view harder.
How I use it
A base amount goes into the market every month no matter what the score says. If the composite drops below 3.5, that amount doubles. Below 2.5, the rest goes in. And if credit spreads blow out past 500 basis points during a real drawdown, money goes in staged tranches as the market falls. The rules were written before any of them triggered, which is the point.
Below: the numbers across every run so far, then each week’s full report as it was generated, unedited.
Not investment advice. This is how I read the market, published as I go.